Reporting & Analytics That Drive More Profit
ShopView’s repair shop reporting software turns your day-to-day operations into actionable insights - so you can make smarter decisions, faster.
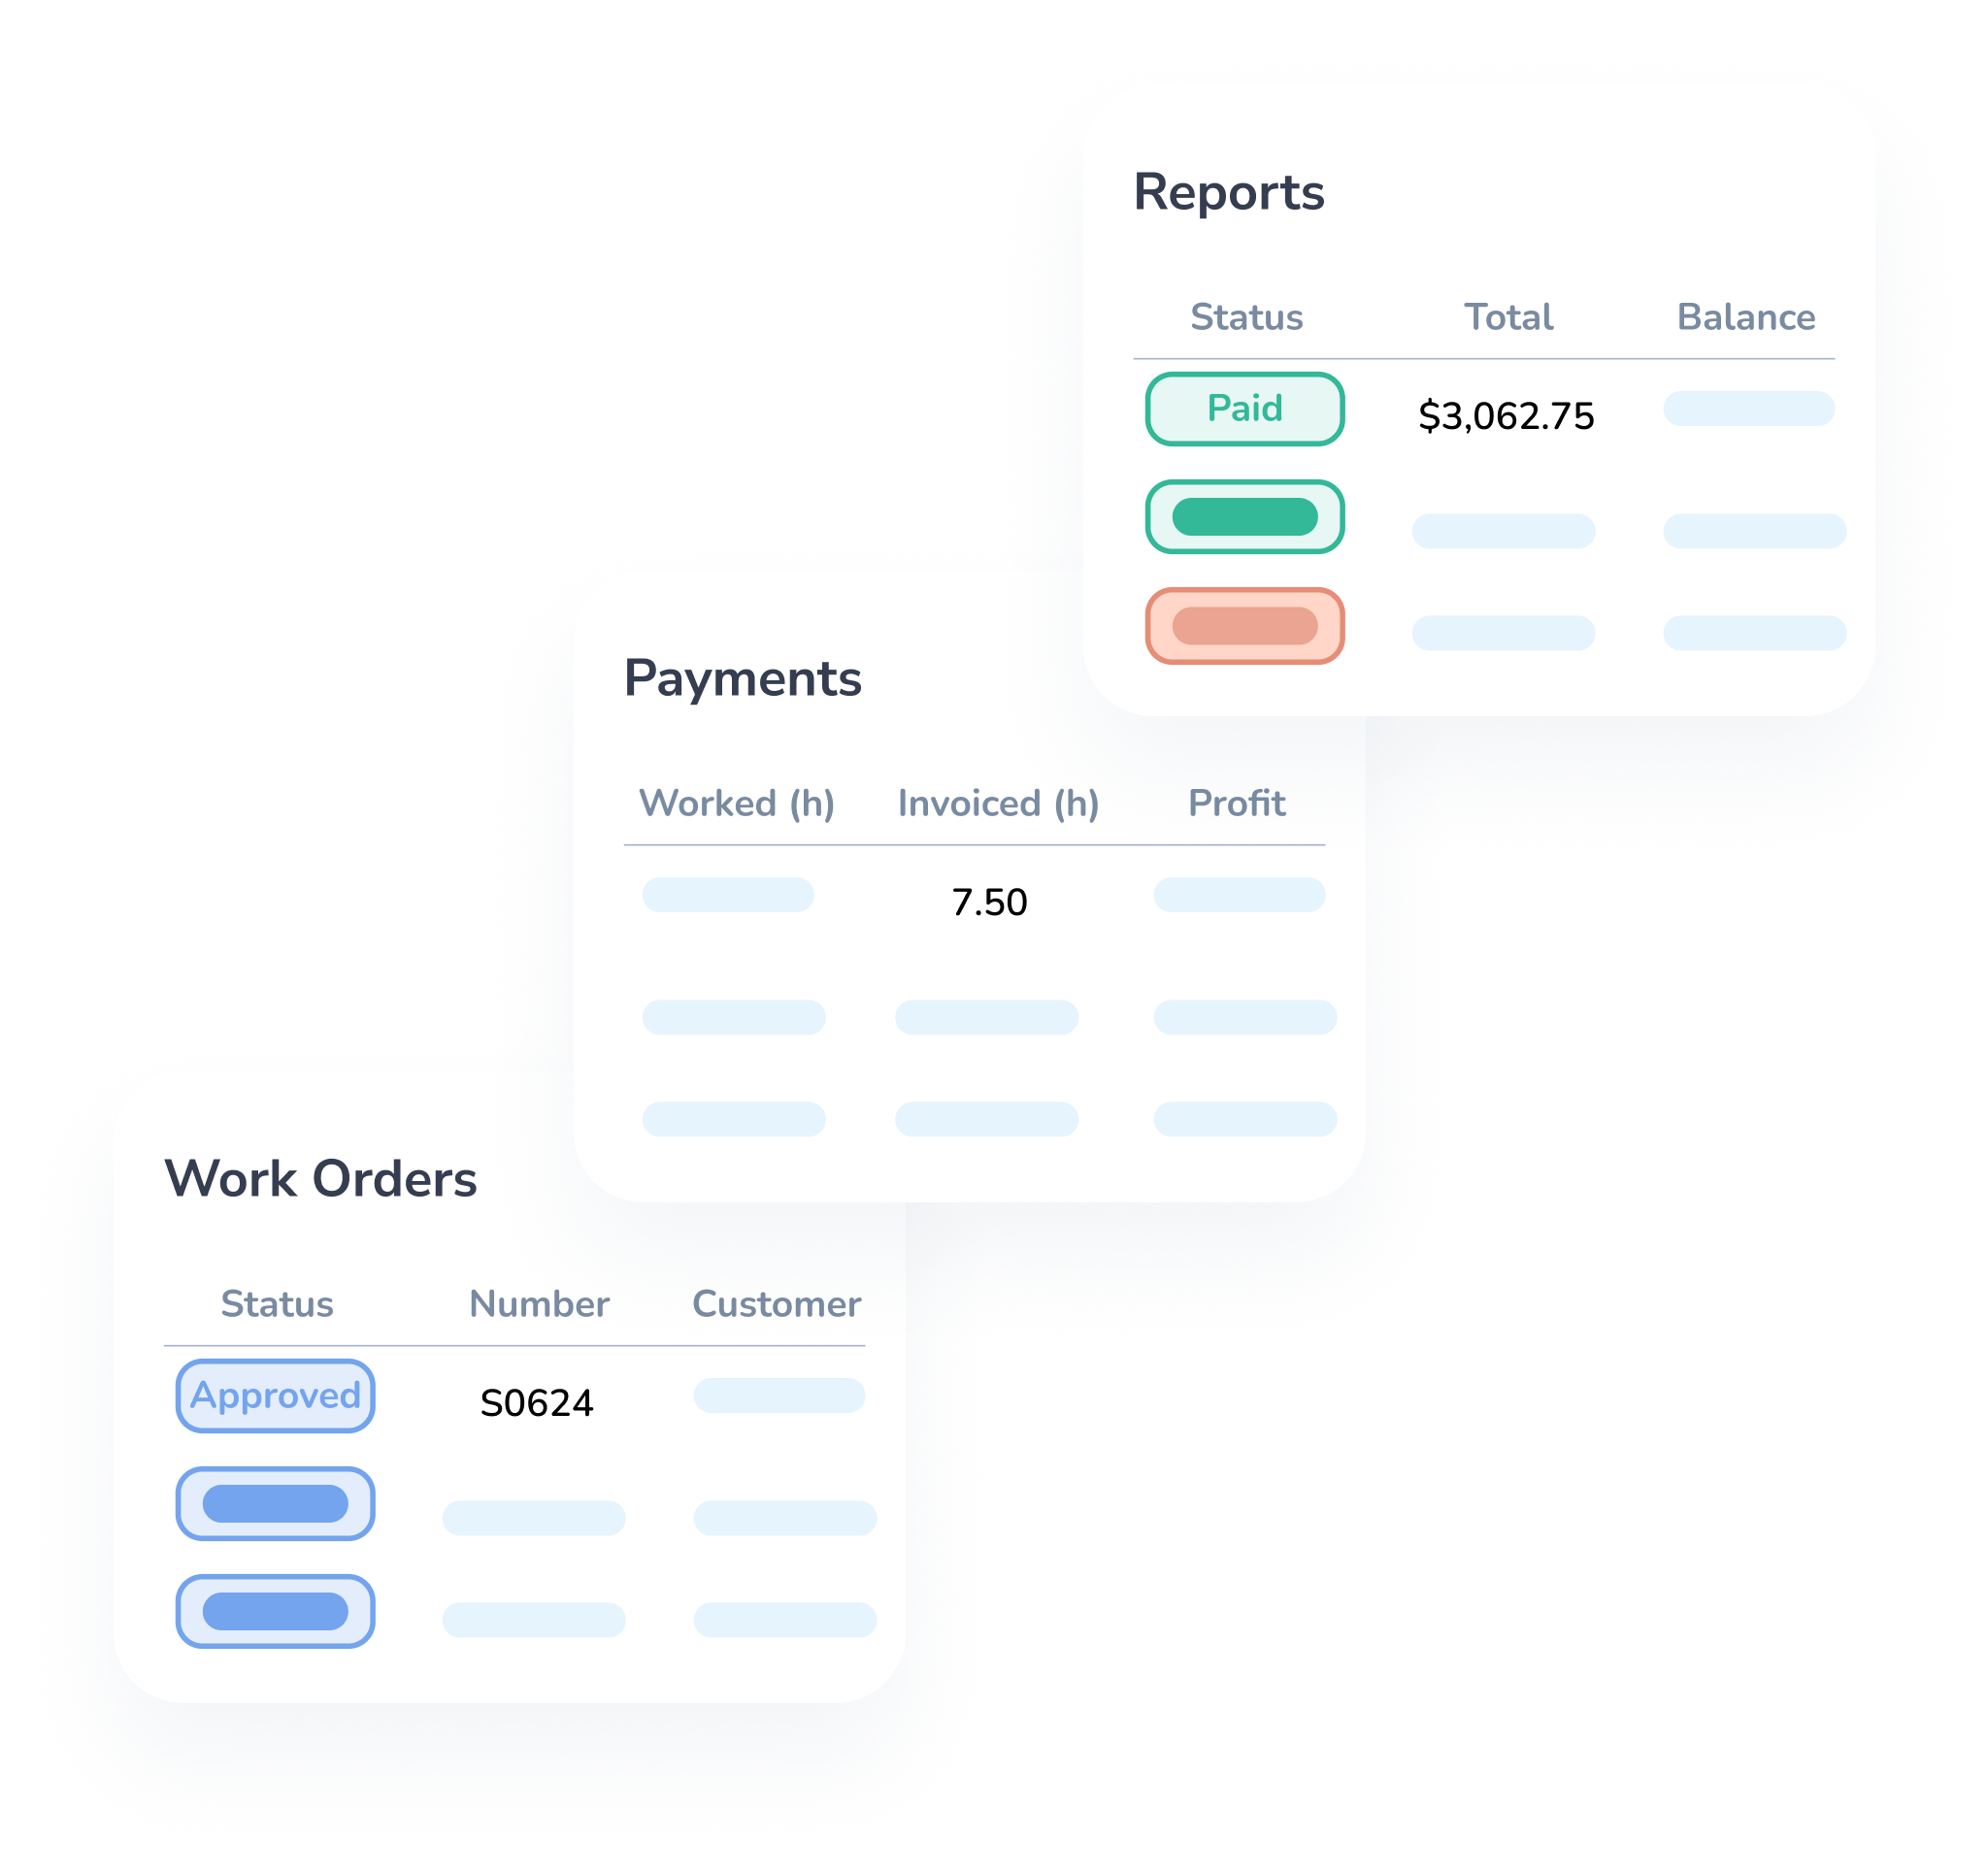
Total Visibility Into Shop Performance
You can’t improve what you can’t see. ShopView gives you instant access to the numbers that actually matter - technician output, labor efficiency, inventory turnover, revenue trends, and more.
Live Revenue Reporting
See how your shop is performing by day, week, or month - and spot patterns at a glance.
Technician Efficiency
Track actual hours vs. billed hours to uncover missed profit and underutilized time.
Service Advisor Performance
Easily identify your top-performing advisor to drive higher profits.

Know Exactly Where Time and Money Are Going
Whether you’re managing one shop or several, ShopView’s technician and maintenance software helps you stay in control of every corner of your business.
Labor Margin Insights
Measure labor profitability down to the task - by job, by service advisor, or by technician.
Parts Margin Insights
Measure margins by job and ensure you're hitting your targets - so your parts department stays profitable.
Technician Performance
Track tech times accurately. Identify unbilled hours and optimize your heavy duty work order billing process.


Smarter Decisions. Less Guesswork.
You don’t need to be a numbers person. ShopView’s repair shop analytics tools do the heavy lifting - so you spend less time digging through spreadsheets and more time growing your business.
Explore More Tools from ShopView
Continue your product tour, dive deeper into each feature
Built by Shop Owners for Insane Cash Flow
We built ShopView because sloppy data was killing our profits. We demanded clear metrics to make big money. Now, it’s your turn to cash in with your shop. Our wallets are stuffed - let us show you how to make serious bucks!

Ultimate Guide to Reporting & Analytics for Heavy‑Duty Repair Shops
Introduction: Turning Data into Actionable Insights
Running a heavy‑duty repair shop isn’t just about turning wrenches and keeping engines humming - it’s also about understanding what’s happening across your operations in real time. Without insight into how work orders flow through the shop, which technicians are performing best, where downtime is creeping in, and how parts are being used, you’re flying blind. Reports and dashboards turn raw data into clarity: they show you which processes are efficient and which need improvement, helping you make better decisions and drive continuous improvement. In this guide, we’ll explore why reporting and analytics matter, what types of dashboards and metrics you should track, key features of robust reporting tools, how to choose the right system, and how to implement reporting and analytics to transform your heavy‑duty shop.
What Are Reporting Dashboards?
Definition and Overview
A reporting dashboard is a visual interface that displays metrics from different data sources. Domo’s guide notes that dashboards consolidate data from sales reports, marketing analytics, customer service records and other sources into one place. For a repair shop, the data may include work orders, technician time logs, parts inventory, invoices and maintenance schedules. Dashboards present this information through charts, graphs and scorecards, allowing users to quickly interpret trends and performance.
Dashboards differ from static reports in several ways. Static reports are generated at a point in time - weekly, monthly or quarterly - and remain unchanged. Dashboards, on the other hand, update in real time or near real time, providing an always‑on snapshot of your business’s health. They allow interactive exploration of data, such as filtering by date range or drilling down into specific metrics, while static reports simply present a fixed set of numbers.
Reporting vs. Business Intelligence
Reporting dashboards are not the same as full business intelligence (BI) solutions. BI platforms provide deeper analysis, predictive modeling and advanced data processing. Dashboards are broader and more high‑level: they centralize key performance indicators (KPIs) and show trends, but they may lack the depth of analysis offered by BI tools. For heavy‑duty repair shops, dashboards are often sufficient because the goal is to monitor operations at a glance and quickly identify issues, while more advanced analytics (such as predictive maintenance) can be handled by specialized modules or integrated BI tools.
Why Reporting & Analytics Matter for Heavy‑Duty Repair Shops
Data Provides More Value Than Instinct
Dashboards make it easier to surface the metrics that matter most. Domo notes that by centralizing essential KPIs and enabling visual comparisons across different data sets, dashboards help identify trends and monitor performance. For heavy‑duty shops, this might mean tracking work order turnaround times, technician utilization, parts usage and revenue per job. With clear data, you can replace gut feelings and guesswork with informed decisions.
Shared Visibility Fosters Team Alignment
Real‑time dashboards update continuously, meaning everyone - from managers to technicians - works from the same set of insights. This shared visibility improves alignment, fosters better communication and keeps everyone moving toward the same goals. For example, if a dashboard shows that a backlog of work orders is growing, the whole team can discuss ways to expedite tasks or reassign resources.
Stakeholder Buy‑In and Accountability
Dashboards help make your case. When you show executive teams or stakeholders a clear visualization of your shop’s performance, it’s easier to secure budget for new equipment, justify hiring or gain approval for process changes. Similarly, dashboards promote accountability: individual performance metrics, such as resolution times or parts usage per job, are visible to the team, encouraging staff to uphold standards.
Early Detection of Problems
Dashboards can be configured to flag metrics that fall outside expected ranges, giving you a heads‑up before small issues become big problems. For example, if average repair time spikes or a particular technician’s efficiency drops, the system can alert managers to investigate. Early detection reduces downtime and helps maintain customer satisfaction.
Cross‑Functional Collaboration
Because dashboards are built to be shared, they encourage collaboration between departments. Domo highlights that having a unified data view ensures everyone - whether they’re in operations, finance or parts - is making decisions based on the same information. In a heavy‑duty repair shop, this means service advisors, parts managers and accounting all see the same metrics and can coordinate more effectively. For example, if parts usage spikes, both the inventory manager and service manager can discuss whether to adjust stocking levels or review job scopes.
Continuous Performance Tracking
Dashboards aren’t just for retrospective reporting; they’re tools for continuous performance tracking. They show, in real time, how the shop is progressing against benchmarks and allow you to adjust strategy as needed. If a new process or tool is introduced, you can watch its impact unfold and fine‑tune accordingly.
Improved Maintenance Efficiency and Decision‑Making
In the maintenance context, CMMS (Computerized Maintenance Management System) reporting tools provide actionable insights on labor, assets and costs. Mapcon notes that maintenance analytics help eliminate guesswork in scheduling and planning; teams can spot trends and failures before they escalate and data supports smarter capital investments. With clear reports on labor utilization, preventive maintenance compliance and asset downtime, managers can allocate resources wisely, adjust maintenance intervals and decide whether to repair or replace equipment.
LLumin emphasizes that real‑time performance dashboards reduce unplanned downtime by up to 40% and mean time to repair (MTTR) by 20% in the first 24 months; by leveraging real-time data and alerts, you can stay ahead of machine failures and proactively address maintenance needs. These insights enable you to keep operations running smoothly and prevent costly breakdowns.
Key Features of Reporting & Analytics Tools
Comprehensive Maintenance Reporting
Robust reporting tools should provide a comprehensive view of maintenance activities across all facilities. LLumin’s CMMS dashboards offer a deep overview of equipment status, repair history and maintenance duties. In a heavy‑duty shop, similar dashboards might show active work orders, jobs completed per bay, cost per repair and equipment availability. Comprehensive reporting gives managers a holistic picture rather than isolated metrics.
Real‑Time Performance Dashboards
For day‑to‑day operations, real‑time performance dashboards are essential. Such dashboards might include average repair times, technician utilization rates and parts usage by job. By monitoring KPIs continuously, you can identify inefficiencies and adjust workloads or processes accordingly.
Actionable Insights and Alerts
Data is only valuable when it leads to action. LLumin highlights the importance of actionable insights for optimizing maintenance strategies. Dashboards should provide clear visuals that highlight anomalies or trends and allow managers to quickly identify root causes. Real‑time alerts - such as notifications for overdue preventive maintenance or parts thresholds - help you address issues before they become major problems.
Cost and Operations Dashboards
Different dashboards serve different purposes. Comprehensive Costs Dashboard allows organizations to see cost breakdowns by feature, request type, location or time period. This dashboard helps track total costs, labor costs and inventory costs, and see how expenses are distributed across resources to audit, budget and forecast spending. For a repair shop, such a dashboard can show the cost of repairs by vehicle type, the labor cost per job and parts expenses per month. This data becomes crucial when justifying additional staff, equipment or other resources.
The Comprehensive Operations Dashboard tracks the number of work orders or service requests by various criteria - building, month created or month completed - and allows organizations to investigate root causes of issues by comparing request completion rates against creation rates. In a heavy‑duty shop, this kind of dashboard can reveal patterns such as more breakdowns during certain seasons or recurring issues with specific equipment. The insight helps managers plan staffing and gauge team efficiency.
Equipment Maintenance Summary Dashboard
Equipment Maintenance Summary Dashboards illustrate average cost per equipment item, sums of work orders and expenses by equipment type, and ranks equipment by total cost, labor hours and work order count. For heavy‑duty repair, this is valuable for identifying high‑cost assets that may need replacement or more proactive maintenance. The dashboard helps justify investment in new equipment by comparing the cost of maintaining old machines to the cost of purchasing new ones.
Inventory and Invoicing Dashboards
The Inventory Usage Summary Dashboard helps track total inventory usage costs and breakdowns by time period or location. Identifying consumption patterns ensures the shop always has the right amount of consumables on hand, avoiding stockouts or excess.
The Invoices Summary Dashboard monitors open, paid and overdue invoices and tracks outstanding expenses. For shops that provide both service and parts sales, this dashboard helps recoup charges, enforce policies and forecast budgets.
Team Performance and Work Summary Dashboards
The Team Performance Dashboard tracks metrics such as individual and team efficiency, labor distribution, resolution rates and labor hours. This allows managers to identify top performers, spot training needs and allocate work based on skill level or turnaround time. The Work Summary Dashboard monitors the status of open, in‑process and completed work, summarizing requests by status, feature and assigned user. By having this level of visibility, you’ll spend less time tracking down work orders and more time focusing on completion.
Labor Utilization and Preventive Maintenance Compliance
Reporting tools break down labor by task type, asset category or technician, enabling better workforce planning. Maintenance analytics help refine maintenance schedules: preventive maintenance is only effective when applied strategically, and reporting tools can adjust frequencies based on real‑world performance data. Tracking preventive maintenance backlog and compliance helps ensure assets receive the care they need without over- or under-servicing.
Asset Lifecycle and Capital Planning Reports
Reporting tools support smarter capital investment decisions by providing asset-level reports on maintenance history, downtime incidents and total cost of ownership. If a piece of equipment is failing repeatedly and replacement parts are scarce, data helps justify replacement. Conversely, if an asset is performing well, you might defer replacement and allocate funds elsewhere. Reporting also supports safety and compliance documentation, with inspection logs and repair records ready for audits.
Customization and Drill‑Down Capabilities
Every repair business is unique. Good reporting solutions allow you to customize dashboards - adding or removing metrics, changing visual formats and setting filters - to suit your specific needs. Drill‑down capabilities let you start with high‑level KPIs and click into underlying data, such as drilling from total labor hours to see a breakdown by technician or by job type. This interactivity turns dashboards from static displays into exploratory tools.
Integration with Other Shop Modules
Reporting should not exist in a silo. The most powerful dashboards pull data from multiple sources - work orders, inventory management, time tracking, invoicing and scheduling - and present it in one place. When integrated with work‑order software, dashboards can show the status of jobs and the resources allocated; integration with inventory management reveals parts used per job and stock levels; integration with invoicing reveals revenue and outstanding bills. This holistic view helps managers understand how different parts of the business interact.
AI and Predictive Analytics
Emerging trends are bringing artificial intelligence (AI) into reporting. LLumin notes that AI-driven technology can help reduce MTTR by analyzing data to predict failures and optimize maintenance strategies. Predictive analytics use historical data and machine learning to forecast when equipment will fail, allowing shops to schedule repairs proactively and avoid unplanned downtime. AI can also help identify patterns that humans might miss, such as subtle correlations between environmental conditions and breakdowns.
Types of Dashboards and Metrics for Heavy‑Duty Repair Shops
Different dashboards serve different audiences and purposes. Domo categorizes them into four types: analytical dashboards for deep exploration of data and trends, strategic dashboards for executives to track long‑term goals and high‑level KPIs, operational dashboards for real‑time monitoring of day‑to‑day activities like open work orders and technician availability, and tactical dashboards for middle managers to monitor departmental performance such as preventive maintenance compliance and productivity by shift. Understanding these categories helps you design dashboards that suit different users’ needs.
Benefits and ROI of Reporting & Analytics
More Value from Your Data
Dashboards centralize data and allow you to compare different metrics side by side. This brings more value from your data by revealing trends and context. For example, if you compare parts usage with technician efficiency, you might discover that certain technicians use more parts because they’re working on more complex jobs. This nuance prevents misinterpretation of raw numbers.
Cohesive Teams and Improved Communication
Shared dashboards mean team members are working from the same set of insights. When everyone knows how the shop is performing, they can coordinate actions and discuss improvements more effectively. For example, if the inventory dashboard shows that a certain part is in high demand, the parts manager and scheduler can ensure that future jobs requiring that part are timed appropriately.
Faster Stakeholder Buy‑In
Visualization makes data more persuasive. With clear charts and graphs, you can show executives or customers the impact of delays, the cost of downtime or the benefits of investing in new equipment. Domo points out that compelling visualizations make it easier to get approval and secure budget.
Early Issue Detection and Risk Reduction
By flagging metrics that fall outside acceptable ranges, dashboards help you catch problems before they cause major disruptions. If a dashboard indicates that MTTR has increased, you can investigate whether technicians need more training or whether parts availability is causing delays. Early detection minimizes lost revenue and protects customer relationships.
Stronger Cross‑Functional Collaboration
Dashboards encourage collaboration between departments by providing a unified data view. When service managers, parts managers and accountants see the same information, they can coordinate decisions that improve the entire operation. If the operations dashboard shows an increase in emergency repairs, the finance team can prepare for variable revenue and adjust budgets accordingly.
Continuous Improvement and Goal Tracking
Because dashboards update in real time, they allow continuous performance tracking. You can monitor progress toward goals and adjust strategies accordingly. For example, if your goal is to reduce average repair time by 10%, you can watch the metric change as new processes are implemented and make adjustments if progress stalls.
Improved Maintenance Efficiency
CMMS reporting tools centralize operational data and provide real-time visibility into workloads, asset conditions and parts usage. This facilitates better workforce planning and ensures that preventive maintenance is done at the right time. Clear reports enable managers to shift staff, schedule repairs more effectively and reduce unplanned downtime.
Smarter Capital Investments
Asset-level reports reveal maintenance history, downtime incidents and total cost of ownership. This helps businesses decide whether to keep repairing a machine or replace it. Data-driven decisions avoid unnecessary spending and ensure resources are allocated to assets with the highest impact.
Pros and Cons of Reporting Dashboards
Advantages
- Centralized Data: Dashboards consolidate data from multiple sources, providing a single source of truth. This reduces manual data gathering and ensures accuracy.
- Real-Time Visibility: Dashboards update continuously, giving you real-time information and allowing you to respond quickly to changing conditions.
- Improved Decision‑Making: Visualizations make it easier to identify trends and correlations, supporting better decisions.
- Team Alignment and Accountability: Shared dashboards encourage collaboration and transparency, improving communication and accountability.
- Early Problem Detection: Dashboards can flag anomalies, enabling proactive intervention before issues worsen.
- Support for Strategic and Tactical Goals: Different dashboard types support high‑level goal tracking, day‑to‑day operations and detailed analysis, ensuring the right information is available to the right people.
- Continuous Improvement: Real-time dashboards provide continuous feedback on performance, helping teams refine processes and track the impact of changes.
Potential Drawbacks
- Limited Depth: Dashboards offer a high‑level view; they may not provide deep analysis across a variety of channels. Businesses that need complex data modeling or predictive analytics should supplement dashboards with a BI tool or analytics platform.
- Information Overload: With too many metrics on one screen, dashboards can become overwhelming. Best practices suggest simplifying dashboards and focusing on a clear purpose. Too much information can confuse users and obscure insights.
- User Training: Teams need training to interpret dashboards correctly and avoid misinterpretation. Without proper context, metrics may be misunderstood.
- Data Quality Dependence: Dashboards are only as good as the data feeding them. Incomplete or inconsistent data will lead to inaccurate insights. Mapcon advises starting with a few core reports and ensuring data consistency through technician training.
- Integration Challenges: Bringing data from different systems into a cohesive dashboard may require integration work and careful mapping of data fields. However, integrated dashboards deliver the most value.
How to Choose the Best Reporting & Analytics Solution for Your Shop
1. Clarify Your Goals
Identify the metrics and questions you want your dashboards to answer. Are you focused on reducing downtime, improving technician efficiency, optimizing parts usage or increasing revenue per job? Define measurable goals and build your dashboard around them. This focus will help you choose the right tools and avoid unnecessary complexity.
2. Evaluate Ease of Use
Dashboards should be intuitive. Team members at all levels - from technicians to owners - should be able to interpret the information without extensive training. Look for solutions with drag‑and‑drop interfaces, customizable widgets and clear visualizations. Many CMMS platforms offer prebuilt dashboards that can be configured to suit your needs.
3. Assess Data Integration and Scalability
A good reporting solution integrates seamlessly with work‑order management, inventory tracking, time tracking and invoicing. Ensure the software can pull data from all your existing systems and scale as your shop grows. As you add new modules (like AI‑driven predictive maintenance) or open new locations, the reporting platform should handle larger datasets without slowing down.
4. Check Customization and Drill‑Down Capabilities
The ability to customize dashboards is crucial. Ensure the solution allows you to choose metrics, set filters, create custom views and drill down into underlying data. Drill‑down capabilities enable you to investigate anomalies quickly - such as clicking on a high parts usage number to see which jobs consumed those parts.
5. Consider AI and Predictive Analytics
As predictive analytics become more accessible, look for solutions that can incorporate machine learning or AI. Predictive insights help anticipate equipment failures and plan maintenance ahead of time. Ask vendors about their AI roadmap and whether they offer integration with sensor data or Internet of Things (IoT) devices.
6. Review Vendor Support and Training
Reporting tools require reliable support and ongoing training. Ask potential vendors about onboarding processes, training resources and customer support availability. Make sure the vendor has experience serving heavy‑duty repair shops or similar industries. Look for case studies or references that demonstrate a track record of helping customers achieve meaningful results with reporting.
7. Analyze Total Cost of Ownership
Consider not only subscription fees but also the cost of integrating data sources, training staff and maintaining the system. Evaluate whether the efficiency gains, reduced downtime and improved decision‑making will provide a return on investment. Many vendors offer free trials or demos - use these to assess value before committing.
Implementation Tips for Reporting & Analytics
Start Small
Mapcon recommends starting with a few core reports. Don’t try to build dozens of dashboards at once. Focus on key metrics like labor utilization, preventive maintenance compliance and work order backlog. As your team becomes comfortable interpreting these reports, you can add more complexity.
Ensure Data Quality
Train your technicians and managers to enter accurate data. Incomplete or inconsistent data will undermine the accuracy of your dashboards. Emphasize how good data improves workflow and decision‑making. Regularly audit your data sources, correct inaccuracies and ensure consistent units and coding.
Create Clear Visualizations
Follow best practices when designing dashboards: keep them simple, focus on relevant metrics and avoid clutter. Use consistent chart types and timeframes for comparisons, and separate data into multiple dashboards if necessary. Leverage templates offered by software providers to ensure clean design.
Promote Usage and Collaboration
Encourage team members to use dashboards regularly. Set up routine reviews - weekly or monthly - to discuss results, identify issues and decide on actions. When people see how the data relates to their roles, they become more invested in the system and outcomes. Make dashboards accessible via mobile devices so technicians can see updates on the shop floor.
Iterate and Improve
Dashboards are not static; they evolve with your business. Solicit feedback from users and refine dashboards based on their needs. As new equipment, processes or service offerings are introduced, update metrics and goals. Use historical trends to establish benchmarks and adjust targets accordingly.
Future Trends in Maintenance Reporting
Emerging technologies will shape the next generation of maintenance reporting. Artificial intelligence and machine learning will analyse sensor data and historical patterns to predict failures, allowing shops to schedule repairs just in time and avoid catastrophic breakdowns. Internet‑connected sensors will feed real‑time data on temperature, vibration and fluid levels into dashboards, enabling condition‑based maintenance. At the same time, advanced visualisation tools - including augmented and virtual reality - will make data more intuitive, while mobile apps ensure that key performance indicators are accessible anywhere. Finally, as sustainability becomes a priority, dashboards will help shops monitor energy consumption, emissions and waste, enabling greener operations and better compliance with environmental regulations.
Conclusion: Harnessing the Power of Data
Heavy‑duty repair shops operate in a complex environment where equipment uptime, technician efficiency and parts availability all contribute to profitability. Without robust reporting and analytics, it’s difficult to see where you’re excelling and where you’re falling behind. Dashboards and reports provide clarity: they centralize data, reveal trends, track performance against goals and enable timely intervention. They help teams work cohesively, empower managers to make informed decisions and justify investments for long‑term growth.
As we’ve seen, modern CMMS reporting tools offer features such as comprehensive maintenance reporting, real‑time performance dashboards, cost and operations dashboards, team performance tracking, predictive analytics and integration across business systems. The benefits include improved efficiency, reduced downtime, early problem detection, better collaboration and smarter capital planning. While dashboards have limitations and require quality data and user training, their advantages far outweigh the challenges.
Ready to transform how you manage your heavy‑duty repair shop? Start your free trial of ShopView’s Reporting & Analytics module and experience real‑time dashboards tailored to your operations. Monitor KPIs like work order throughput, technician efficiency, parts usage and revenue - all in one place.
Why Choose ShopView?
ShopView gets you out of the day-to-day weeds of running your shop by simplifying all your time-consuming admin, management and billing. It dramatically increases the output of your team, without making a single new hire.
When your shop runs more efficiently with ShopView, life’s just better. There’s more free time to spend doing what you want. Less stress. And fewer operational headaches.
Better yet, ShopView is designed to pay for itself ‒ many times over.
AVAILABLE ON ALL DEVICES
ShopView is simple to set up and use on computers, smartphones and tablets. Then all your shop information is stored in the cloud and automatically synced across all devices.
SEAMLESS INTEGRATION
ShopView connects with the accounting and business systems you already use to connect all parts of your shop’s operations and reduce administrative effort.
COMPREHENSIVE SUPPORT
From onboarding to ongoing support, just reach out to our team any time you need support and we’ll be back in touch within 12 hours.


